The
annual Education Development Index (EDI) 2012-13 was released on 6
December 2013 by the National University of Education Planning and
Administration (NEUPA). The EDI comprises of four parameters: access,
infrastructure, teachers and outcomes.
According to the EDI rankings prepared by NEUPA on the basis of
statistics collected by the District Information System for Education
(DISE), Lakshadweep has retained its top position with a composite EDI
score of 0.712.
Composite EDI score is prepared by the NEUPA taking into account both
the performances in primary and upper primary levels.
Lakshadweep is followed by Puducherry (0.696), Tamil Nadu (0.683),
Sikkim (0.672) and Karnataka (0.661).
Among the BIMARU States, the downward slide continues for Uttar
Pradesh, Madhya Pradesh and Rajasthan except Bihar which has recovered
a bit.
Uttar Pradesh has slipped from 32nd in 2011-12 to 34th in 2012-13 with
an EDI score of 0.508. Madhya Pradesh slipped from 26th to 28th slot
with an EDI score of 0.552. Rajasthan slipped from 23rd position to
25th with an EDI score of 0.572.
Other Notable highlights of the EDI Report
• The most remarkable recovery among the northern states is made by Punjab. It has recovered from 13th position to 6th in 2012-13 with an EDI score of 0.647.
• Gujarat has slipped from 9th in 201-12 to 18th in 2012-13 with an EDI score of 0.591.
• Among the southern states the biggest decline has been of Kerala. It has slipped from 7th in 2011-12 to 14th in 2012-13 with an EDI score of 0.603.
• The reason for overall poor ranking of Kerala has been on account of reverses in primary education. In primary education, the state's rank went down to 20th from sixth in 2011-12.
• Delhi slipped from 6th in 2011-12 to 11th in 2012-13 in overall ranking with an EDI score of 0.627.
• Maharashtra has shown consistency retaining its 8th with an EDI score of 0.635.
|
TOP FIVE STATES |
LOWER FIVE STATES |
||
|
STATES |
EDI SCORE |
STATES |
EDI SCORE |
|
1. Lakshadweep |
0.712 |
31. West Bengal |
0.527 |
|
2. Puducherry |
0.696 |
32. Assam |
0.527 |
|
3. Tamil Nadu |
0.683 |
33. Goa |
0.520 |
|
4. Sikkim |
0.672 |
34.Uttar Pradesh |
0.508 |
|
5. Karnataka |
0.661 |
35. Jharkhand |
0.452 |
A
Brief Analysis:-
The rankings reflect the achievements of the states in the education
sector. Variety of indicators presented in the flash statistics
revealed improvement in all the components of universal elementary
education including average annual drop-out rate and retention at
primary level of education. Moreover, more schools now have drinking
water and toilet facility and other necessary infrastructure in school
than in the previous year.
The EDI rankings reflect that there remains huge gap between the
southern and the northern region. When the EDI of southern and
northern States is compared, it indicates that the southern states
have improved leaps and bound after the enactment of the Right to
Education (RTE) Act. However, the northern States like Bihar, Uttar
Pradesh, Rajasthan and others despite their best efforts have proved
to be no match.
Background
Education Development Index (EDI) is a joint effort of Ministry of
Human Resource Development (MHRD), Government of India and the
National University of Educational Planning and Administration (NUEPA).
Ranking of States on the basis of EDI started in 2005-06.
The purpose of EDI is to summarize various aspects related to input,
process and outcome indicators and to identify geographical areas that
lag behind in the educational development.
Initially 24 indicators were indentified for computing EDI. These
indicators were based on the data collected by the District
Information System for Education (DISE).
In 2009, the indicators for computing EDI were revised from 24 to 29.
These indicators have been grouped under four areas namely Access,
Infrastructure, Teacher and Outcome.
Methodology
After data provided by DISE is collected and cleaned, each indicator
is normalised by using the following formula:
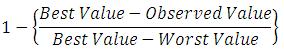
Upon receiving normalised values, Principal Component Analysis (PCA)
is applied to decide the factor loading and weights.
In case of a few variables, policy options were explored to identify
the best values instead of based on the observed values. Some of these
variables are: percentage of schools with pupil-teacher and
students-classroom ratio above 30 and 35 (best value, zero),
percentage of teachers without professional qualification (best value,
zero) etc.
List of Indicators in EDI
|
COMPONENT |
INDICATOR |
|
ACCESS |
Density of Schools per 10 Sq. Km |
|
Availability of schools per 1000 child population |
|
|
Ratio of primary to Upper Primary Schools/Sections |
|
|
INFRASTRUCTURE |
Percentage of Schools with Student-Classroom Ratio: Primary >30 and Upper-Primary > 35 |
|
Percentage of Schools with 1:1 Classroom-Teacher Ratio |
|
|
Percentage of Schools with Drinking Water facility |
|
|
Percentage of Schools with Boys Toilet |
|
|
Percentage of Schools without Girls Toilets |
|
|
Percentage of Schools Required and have Ramp |
|
|
Percentage of Schools with Kitchen-Shed ( Government & Aided Schools) |
|
|
TEACHER |
Percentage of schools with female teachers ( in schools with 2 and more teachers) |
|
Percentage of Schools with Pupil-Teacher Ratio: Primary >30 & Upper Primary > 35 |
|
|
Percentage of Single-Teacher Schools |
|
|
Teachers without Professional Qualification |
|
|
OUTCOME |
Average number of instructional days -Upper Primary |
|
Average number of Instructional days |
|
|
Average working hours for teachers |
|
|
Percentage of change in enrollment in Gov schools over the previous year |
|
|
Gross Enrollment Ratio |
|
|
Participation of SC children: Percentage of SC Population (2001 census): Percentage of SC Enrollment |
|
|
Participation of ST children: Percentage of ST Population (2001 census): Percentage of ST Enrollment |
|
|
Participation of Muslim children: Percentage of Muslim Population (2001 census : Percentage of Muslim Enrollment |
|
|
Ratio of Girls Enrollment to Boys Enrollment |
|
|
Drop-out rate |
|
|
Transition Rate for primary to upper primary level |